

The top menu in D4Dashboards contains different elements, depending on what you have open.
The first thing you encounter looks like this:

In the top menu at the top left, you can always click D4Dashboards to return to the overview of dashboard groups.

The Overview tab takes you to the dashboard group overview. In the field by Go to dashboard you have the option to search for a specific dashboard by entering the ID number that the dashboard in question has. You can find the dashboard ID in the address bar of your browser when the dashboard is open. In the example below, the dashboard in question has ID number 7.
http://manualwebuk/D4Dashboards/Admin/dashboard/?id=7&categoryID=10
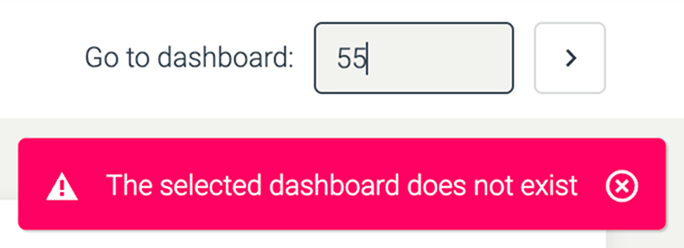
If you type 7 in the search field, you will be taken directly to the dashboard in question. If there is no dashboard with the ID you are searching for, you will briefly see a message stating this:
When you open a dashboard, you will find these buttons in the top menu on the right:

Background image

Click to select a background image as the background for your dashboard.
You can choose from the default images in the system.
You also have the option to upload your own image for use in D4Dashboards via the shared image database. To upload the image, insert the following path after your site address in the URL:
/D4Doc/bookedit/scripts/newimage/imgwindow.asp?/ Choose /images in the dropdown and click upload.

Click Upload. This and all subsequent uploaded images in the folder D4Dahboards will then be available in D4Dashboards for you to choose.
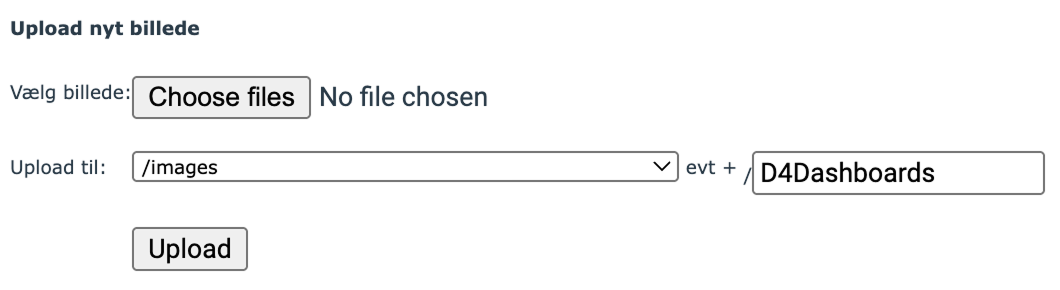
Please note: If you subsequently want to upload more images to use as a background, the D4Dashboards folder has now been created, and you must select /images/D4Dashboards in the Upload to dropdown menu and not type anything in the new folder +/ field.
See more about uploading an image in the manual for D4Handbooks.
Bemærk: Vil du senere uploade flere billeder til brug som baggrund, er mappen D4Dashboards allerede oprettet. Vælg da /images/D4Dashboards i dropdownmenuen Upload til, og lad evt. +/-feltet stå tomt.

Indlæg
Se også: [ D4Handbooks artikel ] for at læse mere om upload af billeder
Show preview
Here you can preview your dashboard as it will appear to users when it is published.

Publication
Clicking this button will give you the option to save and publish your dashboard. Read more about this in section 6.
Indlæg
Se også: Udgiv dashboard
Save draft
If you want to save your work with the dashboard and come back and continue working later, click this button. When you access a dashboard, the button will be grey and therefore not active. It will become green and active as soon as a change has been made to the opened dashboard.